EOR Cost by Country: Fees, Employer Contributions and Total Cost (24 Countries)
The total cost of an employee through an EOR is salary, plus employer contributions (6% to 35% depending on the country), plus the EOR fee ($199 to $700 a month). This table puts all 24 countries we cover side by side.



Buyers ask us for one number: what does an employee cost through an EOR in country X? The honest answer is three numbers. The EOR service fee (what the provider charges), the employer contributions the law adds on top of gross salary, and the employee-side deductions that determine net pay and therefore the gross you need to offer. The table below puts all three side by side for the 24 countries we cover, with a link to the full guide for each.
How to use the table
- Total on top of salary is employer contributions plus typical mandatory benefits, before the EOR fee. Add the EOR fee (a flat monthly amount, not a percentage) to get the all-in cost.
- Fee ranges are the published or quoted ranges for mainstream providers in that country; a provider with its own entity is usually at the low end, a partner-served one at the high end.
- Percentages are statutory rates as of the October 2026 re-audit. Thresholds and caps apply; the country guides give the detail.
| Country | EOR fee / month | Employer contributions | Employee contributions | Income tax | Total on top of salary |
|---|---|---|---|---|---|
| Argentina | $400–600/mo | 17–21% | ≈17% | 0–35% progressive | ~30–35% |
| Brazil | $500–700/mo | 20–28.8% | 7.5–14% | 7.5–27.5% | ~45–55% |
| China | $400–600/mo | ≈26–28% + housing fund | 10.5–11% | 3–45% progressive | ~35–45% |
| Colombia | $350–550/mo | 21.5–25% | 4% health + 4% pension | 0–39% progressive | ~35–42% |
| France | $600–900/mo | ~42–45% | 22% | 0–45% progressive | ~45–55% |
| Germany | $550–800/mo | ≈21.2% | 20% | 0–45% progressive | ~30–40% |
| India | $300–500/mo | 12% EPF + 3.25% ESIC | 12% EPF | 0–30% progressive | ~20–28% |
| Kenya | $250–400/mo | NSSF 6% + 1.5% housing levy | 6% | 10–30% progressive | ~15–20% |
| Mexico | $400–600/mo | 26–32% | 3% | 1.92–35% | ~38–45% |
| Nigeria | $250–400/mo | 10% | 8% pension | 0–25% progressive | ~22–28% |
| Peru | $300–500/mo | 9% + 0.75–1.55% | 9–13% AFP | 8–30% progressive | ~25–32% |
| Philippines | $300–500/mo | ≈14.5% | ≈9.5% | 0–35% | ~20–28% |
| Poland | $400–600/mo | ≈20.5% | 13.71% | 12–32% | ~30–38% |
| Romania | $350–550/mo | 2.25% | 25% + 10% health | 10% flat | ~32–40% |
| Serbia | $300–500/mo | 15.15% | 20% | 10–20% | ~28–36% |
| Singapore | $500–800/mo | 17% CPF | 20% CPF | 0–24% progressive | ~22–28% |
| South Africa | $350–550/mo | 1% SDL + 1% UIF | 1% UIF | 18–45% progressive | ~15–22% |
| Spain | $550–800/mo | ≈31.5–32% | 6.35% | 19–47% progressive | ~38–48% |
| Switzerland | $700–1100/mo | ~12–13% | 12% | 0–11.5% | ~22–28% |
| Ukraine | $250–400/mo | 22% USC | 5% military levy | 18% flat | ~28–35% |
| United Arab Emirates | $500–800/mo | 0% expats / 15% nationals | 0% expats / 11% nationals | 0% | ~10–20% |
| United Kingdom | £450–600/mo | 15% | 8% NI | 0–45% progressive | ~20–25% |
| United States | $500–900/mo | 7.65% FICA + SUI | 7.65% FICA | 0–37% + state | ~18–30% |
| Vietnam | $250–400/mo | 21.5% + 2% union fee | 10.50% | 5–35% | ~28–36% |
Reading across countries
Two patterns matter more than any single line. First, employer contributions vary by a factor of five: Singapore, the Philippines and several African markets sit well under 15%, while France, Brazil, Spain and Argentina sit around 30% or above. A salary that looks expensive in Germany can be cheaper all-in than a "cheap" market with high statutory costs. Second, the EOR fee matters less as salary rises: at a $30,000 salary a $599 fee is 24% of cost; at $120,000 it is 6%. For senior hires, negotiate on FX markup and termination terms rather than on the headline fee.
Related reading

Published October 20, 2026
3 min read
EOR vs PEO: Which One Do You Actually Need?
An EOR becomes the legal employer of your staff abroad; a PEO co-employs people in a country where you already have an entity. Pick by the question "do we have an entity there?"

Published October 20, 2026
3 min read
How Compareor Scores EOR Providers
Every provider score is three weighted dimensions (compliance and coverage, platform and features, pricing and transparency) built from verifiable sources. Here is exactly how, and what we leave out.
Published June 3, 2026
6 min read
I checked the structure of 150+ EOR providers. Here's how many actually own their entities.
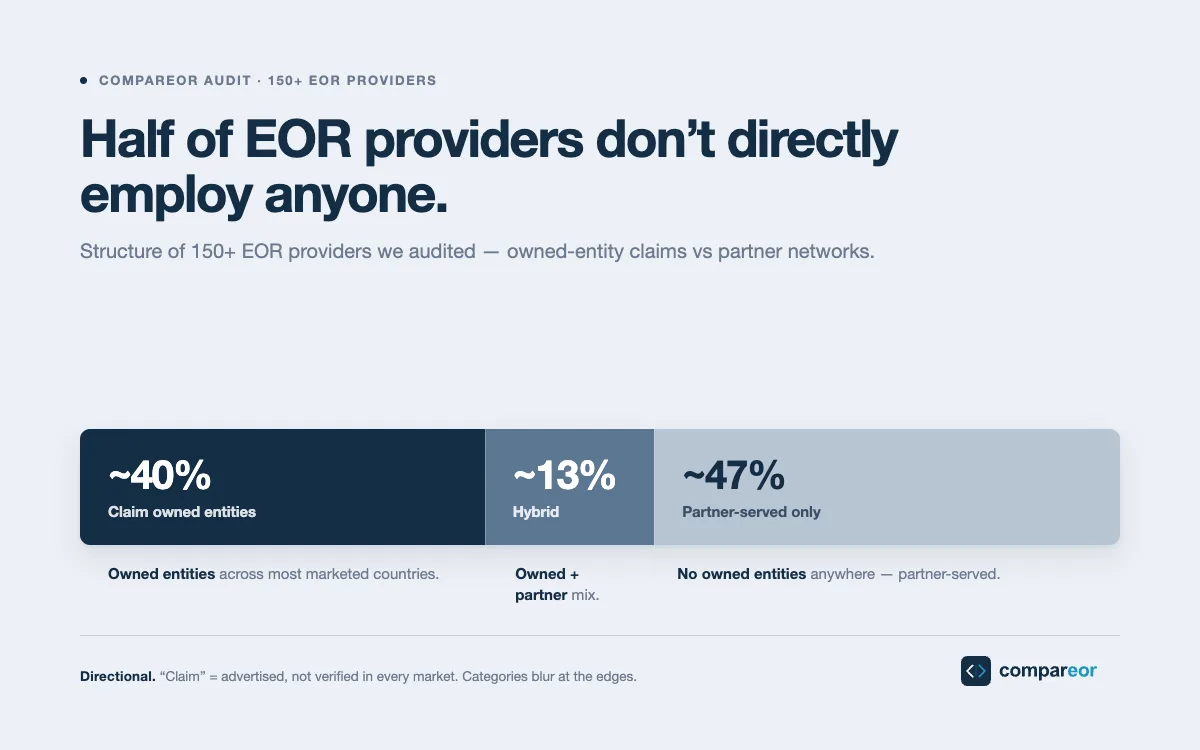
About 40% of EOR providers I audited claim and substantiate owned entities across most of their marketed countries. About 12 to 15% run an honest hybrid. About 45 to 50% are partner-served only, with no owned entities anywhere. The numbers, the methodology, the one honest caveat, and what they mean for buyers.
Stay Updated on Global Hiring
Get weekly insights on EOR trends, compliance updates, and cost-saving strategies

Find a better EOR — without risk
Compare EOR providers to gain insights on cost, coverage, and contract flexibility, ensuring compliance and payroll continuity.