Average EOR Cost in 2026: The Compareor Benchmark (1,200+ Quotes)
The average EOR cost in 2026 is $549/employee/month, but country and provider-tier deltas dominate the calculation. Full benchmark built from 1,200+ normalised quotes, refreshed quarterly — with the fully-loaded cost for 16 key markets.


.png)
Average EOR cost in 2026 — and why most published numbers are wrong
What does an EOR cost in 2026? is one of the most-searched queries in the global employment category, and it has the worst-quality answers anywhere on the internet. Most published numbers are pulled from a single provider's website pricing page (which is the rack rate, not what anyone actually pays), or are vague ranges with no methodology, or are out of date by 12–18 months because the market has moved. The accurate answer requires actual quote data, normalised across cost layers, refreshed continuously, and reported at the country and provider-tier level — not a single number.
This benchmark is built from Compareor's analysis of over 1,200 EOR pricing quotes collected directly from 35+ providers between Q1 2024 and Q1 2026, normalised to a standard template covering gross salary, employer statutory, benefits at cost, benefits markup, EOR service fee, setup, FX spread, float, termination, and renewal cap. The numbers below represent what companies actually pay — including the negotiated discount, the benefits markup, and the FX spread — not what the provider's homepage shows.
This post covers the headline service fee benchmarks across major provider tiers, the fully-loaded cost by country, how prices have moved over the last two years, what to expect at different volume tiers, and how to use these benchmarks in your own procurement process. Pair with the quote decoder for line-by-line interpretation, the negotiation playbook for the procurement work, and the G2-ranked leaderboard for fit-based shortlisting.
How this benchmark is built — methodology
The data underlying this benchmark comes from three sources. First, direct provider quotes — 1,200+ quotes collected from 35+ providers between Q1 2024 and Q1 2026, normalised to the standard cost template. Second, public pricing data — the rack rates published on provider websites, used as the upper bound and the starting point for negotiation. Third, post-signing invoice data — the actual cost buyers ended up paying, sourced from companies running active EOR contracts who share anonymised data through Compareor's benchmark program.
The result is a three-tier view of EOR cost. Rack rate is the provider's published number — the starting point of any quote conversation. Market rate is the typical negotiated quote for a standard buyer at standard volume. Floor rate is what the most disciplined buyers achieve through full-stack negotiation with partner-network discounts applied. The spread between rack and floor is typically 25–40% of total cost — which is the negotiable margin, and the reason a benchmark matters at all.
Average EOR service fee in 2026
The average EOR service fee in 2026 is $549 per employee per month, across all providers and country combinations, weighted by transaction volume. That number is useful as a single anchor but conceals more than it reveals. The actual range runs from $249/employee/month (mid-tier providers, lighter-load countries, mid-volume contracts) to $1,200+/employee/month (premium providers, complex jurisdictions, low-volume contracts).
Within that range, the most useful breakdown is by provider tier. The market has consolidated into three distinct tiers with materially different pricing structures.
Top tier — Deel, Remote, Velocity Global, Globalization Partners. Rack rate: $599–$799/month. Market rate: $499–$649. Floor rate: $399–$549.
Mid tier — Multiplier, Oyster, Rippling EOR, Papaya Global, Native Teams. Rack rate: $399–$599/month. Market rate: $299–$499. Floor rate: $249–$399.
Specialised / regional — Boundless, Atlas, Plane, and regional Asia / LATAM specialists. Rack rate: $599–$1,200/month. Market rate: $499–$899. Floor rate: $399–$749.
The headline service fee is only one of seven cost layers in a full EOR contract. The next section covers the fully-loaded cost, which is the right number to budget against.
Fully-loaded EOR cost by country in 2026
The fully-loaded cost is gross salary plus employer statutory contributions plus benefits at cost plus benefits markup plus 13th-month accrual (where applicable) plus EOR service fee plus amortised setup plus FX spread. This is what hits your P&L each month for each employee. For a $5,000/month gross salary mid-level engineer (the most common reference profile in this benchmark), fully-loaded cost by country lands as follows:
United Kingdom — Employer statutory $690, benefits (incl. markup) $250, no 13th month. TEC excl. EOR fee: $5,940. EOR service fee: $499. Fully-loaded monthly: $6,439.
Germany — Employer statutory $1,000, benefits $400, no 13th month. TEC: $6,400. EOR fee: $549. Fully-loaded: $6,949.
France — Employer statutory $1,500, benefits $300, 13th-month required. TEC: $6,800. EOR fee: $599. Fully-loaded: $7,399.
Spain — Employer statutory $750, benefits $200, 14th-month required. TEC: $5,950. EOR fee: $499. Fully-loaded: $6,449.
Italy — Employer statutory $1,400, benefits $300, 14th-month required. TEC: $6,700. EOR fee: $549. Fully-loaded: $7,249.
Netherlands — Employer statutory $1,000, benefits $350, no 13th month. TEC: $6,350. EOR fee: $549. Fully-loaded: $6,899.
Portugal — Employer statutory $850, benefits $250, 14th-month required. TEC: $6,100. EOR fee: $549. Fully-loaded: $6,649.
Brazil — Employer statutory $1,950, benefits $450, 13th-month required. TEC: $7,400. EOR fee: $649. Fully-loaded: $8,049.
Mexico — Employer statutory $1,250, benefits $300, aguinaldo bonus required. TEC: $6,550. EOR fee: $599. Fully-loaded: $7,149.
Argentina — Employer statutory $1,400, benefits $250, 13th-month required. TEC: $6,650. EOR fee: $649. Fully-loaded: $7,299.
India — Employer statutory $850, benefits $200, no 13th month. TEC: $6,050. EOR fee: $399. Fully-loaded: $6,449.
Philippines — Employer statutory $650, benefits $300, 13th-month required. TEC: $5,950. EOR fee: $399. Fully-loaded: $6,349.
Singapore — Employer statutory $850, benefits $200, no 13th month. TEC: $6,050. EOR fee: $549. Fully-loaded: $6,599.
Australia — Employer statutory $750, benefits $400, no 13th month. TEC: $6,150. EOR fee: $549. Fully-loaded: $6,699.
United States — Employer statutory $750, benefits $500, no 13th month. TEC: $6,250. EOR fee: $499. Fully-loaded: $6,749.
Canada — Employer statutory $1,000, benefits $350, no 13th month. TEC: $6,350. EOR fee: $549. Fully-loaded: $6,899.
The right way to use this table is as a procurement anchor. When a quote arrives, compare its fully-loaded monthly to the row for the relevant country. If your quote sits within 10–15% of the benchmark, the provider is pricing in line with the market. If it sits above 15%, the difference is likely in benefits markup or FX spread — both of which are negotiable. The country-by-country deep dive has the full statutory breakdown per country.
How EOR prices have moved from 2024 to 2026
The market has gone through four significant changes between Q1 2024 and Q1 2026, all of them broadly in the buyer's favour but with one notable holdout:
EOR service fee — $562/month average in Q1 2024, $549/month in Q1 2026. Two-year change: −2.3%.
FX spread — 2.7% average in Q1 2024, 1.8% in Q1 2026. Two-year change: −33%.
Benefits markup — 18% average in Q1 2024, 17% in Q1 2026. Two-year change: −5.6%.
Setup fee — $283 average in Q1 2024, $124 in Q1 2026. Two-year change: −56%.
Contracts with a renewal cap clause — 29% in Q1 2024, 61% in Q1 2026. Two-year change: +110%.
Headline service fees have been roughly flat with mild downward pressure — the major providers' rack rates have moved 0–3% in either direction, and the competitive dynamic between Deel, Remote, and the mid-tier has prevented either erosion or escalation. FX spreads have compressed materially, largely driven by Deel's 2022 move to mid-market pricing, which pulled the rest of the market toward disclosure. Setup fees have all but disappeared at the top tier and dropped sharply in the mid-tier. Renewal caps have moved from a buyer-negotiated extra to a standard provision in over 60% of contracts.
The notable holdout is benefits markup, which has barely moved in two years. This is the cost layer the market has been slowest to compress, because most buyers do not know to ask about it. It remains the single largest source of hidden margin in EOR contracts and the most reliable lever for buyers who do ask.
Volume-based discount benchmarks
EOR pricing breaks at predictable volume thresholds. The biggest cliff is at roughly 15 employees, where most providers unlock their enterprise pricing book. The second is around 50, where bundled-deal and custom pricing become available.
1–5 employees — Headline discount 0–5%. Setup waiver sometimes available. Benefits markup at standard 15–25%. Rack-rate territory.
5–15 employees — Headline discount 5–15%. Setup waiver usually available. Benefits markup at standard. Standard discount tier.
15–50 employees — Headline discount 15–25%. Setup waived. Benefits markup negotiable to 5–10%. Enterprise pricing book unlocks at this threshold.
50–100 employees — Headline discount 20–30%. Setup waived. Benefits markup negotiable to 0–5%. Custom contracts with bundled bonuses available.
100+ employees — Headline discount 25–40%. Setup waived. Benefits markup at pass-through. Annual deals, dedicated CSM, custom SLAs.
Two-year and three-year commitments unlock an additional 5–10% on top of the volume-based discount. The negotiation playbook covers the full leverage stack.
What is not in the average
The benchmarks above are useful anchors but not predictions for any specific situation. Three factors create meaningful deviation from the country and tier averages.
Country mix. A contract concentrated in high-cost-to-serve markets (Brazil, India, China) prices materially higher than a contract concentrated in light-friction markets (UK, Spain, Netherlands). The provider's operational overhead by country is uneven, and the margin available to discount varies accordingly. A mixed-country contract typically prices at the weighted average of its components, but with a small premium for complexity.
Company maturity. Established companies with audited financials get better float terms, lower FX spreads, and more flexibility on payment terms than early-stage startups. The difference can be 5–10% of total cost over a contract term.
Contract length. Multi-year commitments unlock 5–10% additional discount, but only if the operational fit is proven before signing. The trade-off is real — you are committing to the provider for the term — and only worth taking if you have validated the relationship over at least one full annual cycle.
Beyond these standard variables, several scenarios fall outside the catalogue benchmark entirely: highly regulated industries (defence, gaming, regulated finance), markets where the provider relies on partner networks instead of owned entities (partner pricing typically runs 20–30% above), specialised roles requiring local sponsorship beyond standard employment (work permits, visa sponsorship), and jurisdictions with currency controls or sanctions exposure. Expect quotes 30–50%+ above benchmark in these scenarios and treat each as bespoke pricing rather than catalogue pricing.
How to use these benchmarks in negotiation
Four practical applications, in roughly decreasing order of value.
Anchoring. When a quote arrives, compare its fully-loaded monthly to the relevant country and tier benchmark. If the quote is above market rate by more than 10–15%, you have room to negotiate. The framing in conversation: based on benchmark data for [country] at our volume tier, the market rate for this scope is approximately $X. Your quote at $Y is meaningfully above that — can you walk us through where the delta lives?
Side-by-side comparison. When you have two or three quotes, normalise each against this benchmark and identify where each provider is pricing aggressively versus where they are pricing high. Two providers can quote similar bottom-line totals with completely different cost structures underneath. The benchmark surfaces which structure favours you over the contract term.
Renewal defence. When your renewal quote arrives, compare it against the current benchmark (not your year-one number). If the renewal is above current market, you have grounds to push back regardless of the contract escalator. The benchmark refreshes the conversation away from last year plus inflation toward today's market rate.
Walk-away calibration. If a provider is more than 25% above benchmark on a comparable scope, the structure is the issue, not the negotiation. The cost layers are loaded with margin in a way no amount of negotiation will fully unwind. Try a different provider. The G2-ranked leaderboard filters for providers with consistently market-aligned pricing.
Frequently asked questions
What is the average EOR cost per employee per month in 2026?
The average EOR service fee is $549 per employee per month across all providers and countries, weighted by transaction volume. The fully-loaded cost — including statutory contributions, benefits, and FX — runs $6,300–$8,100/month for a $5,000/month gross salary employee, depending on country. Country deltas dominate the calculation; provider deltas are smaller.
Why do EOR prices vary so much by country?
Three structural factors. First, employer statutory contributions vary from 7.65% (US FICA) to 35–42% (Brazil INSS+RAT+Terceiros). Second, mandatory benefits differ — rich social systems in northern Europe versus private-market in the US. Third, EOR operational complexity varies — entity ownership versus partner network, language support depth, jurisdiction-specific compliance overhead. The country breakdown has the full mechanics per market.
Which EOR is cheapest in 2026?
Cheapest on a comparable scope is rarely the right question — coverage, support, and platform quality matter as much as pricing. That said, mid-tier providers (Multiplier, Native Teams, Oyster) consistently price 15–25% below top-tier (Deel, Remote, Velocity Global) on headline service fee at standard volumes. Floor-rate pricing for mid-tier providers starts at $249/employee/month at meaningful volume. The G2 leaderboard ranks by fit, not price alone.
Are EOR prices going up or down in 2026?
Sideways with mild downward pressure. Headline service fees have moved −2.3% from Q1 2024 to Q1 2026. FX spreads have compressed −33%. Setup fees have dropped −56%. Renewal caps have become much more common (+110%). The notable holdout is benefits markup, which has barely moved (−5.6%) and remains the largest source of hidden margin in most contracts.
What is the difference between rack rate, market rate, and floor rate?
Rack rate is the provider's published price — the website number, the first-quote number, the upper bound of the negotiation. Market rate is the typical negotiated quote for a standard buyer at standard volume — what most companies end up paying. Floor rate is what the most disciplined buyers achieve through full-stack negotiation, partner-network discounts, and volume commitments. The rack-to-floor spread is typically 25–40% of total contract cost.
Where does the benchmark data come from?
Three sources. Over 1,200 EOR pricing quotes collected directly from 35+ providers between Q1 2024 and Q1 2026, normalised to a standard cost template. Public provider rack-rate pricing scraped continuously. Post-signing invoice data from companies running active EOR contracts who share anonymised data through Compareor's benchmark program. The benchmark refreshes quarterly.
Can I get a Compareor advisor to benchmark my specific quote?
Yes, for free. A Compareor advisor will normalise your quote against the relevant country and tier benchmark on a call, identify where each cost layer sits in the market, flag any line items above market, and (where the provider is in the partner network) apply pre-negotiated discounts on top. The service is compensated by the provider on closing, not by the buyer — there is no cost to you and no obligation to proceed.
Bottom line
The average EOR cost question cannot be answered in a single number, but the benchmark above is the most accurate approximation available — built from 1,200+ normalised quotes, refreshed quarterly through Q1 2026, and reported at the country and provider-tier level. The headline number ($549/employee/month service fee, $6,300–$8,100/month fully-loaded for a $5,000 gross salary engineer) is a useful anchor. The country and tier tables are the actual procurement tool.
Three takeaways. First, the headline service fee is the smallest variable in total cost — country-specific statutory cost and benefits structure dominate the calculation. Budgeting on headline fee alone systematically understates true cost by 15–25%. Second, the market has moved gently in the buyer's favour over the last two years (FX, setup, renewal caps) but benefits markup has held — that is where most hidden margin still lives, and where most negotiation effort should go. Third, the average is an anchor, not a target. Your specific contract should land within 10–15% of the relevant benchmark on a comparable scope; if it does not, the difference is in the structure, not the headline.
Use this benchmark as the anchor for your procurement process. Compare every quote you receive against the relevant country and tier row above. Pair with the quote decoder for line-by-line interpretation and the contract review checklist for the signing stage. If you want a human to run the comparison on your specific quotes, a Compareor advisor will walk through them against the benchmark on a call, identify where each one sits in the market, and tell you whether to negotiate, switch, or sign. The benchmark is free. The advisor is free. The only cost is signing a quote that is significantly above market when it did not need to be.
Get your shortlist
Takes ~3 minutes. No account needed.
June 3, 2026
6 min read
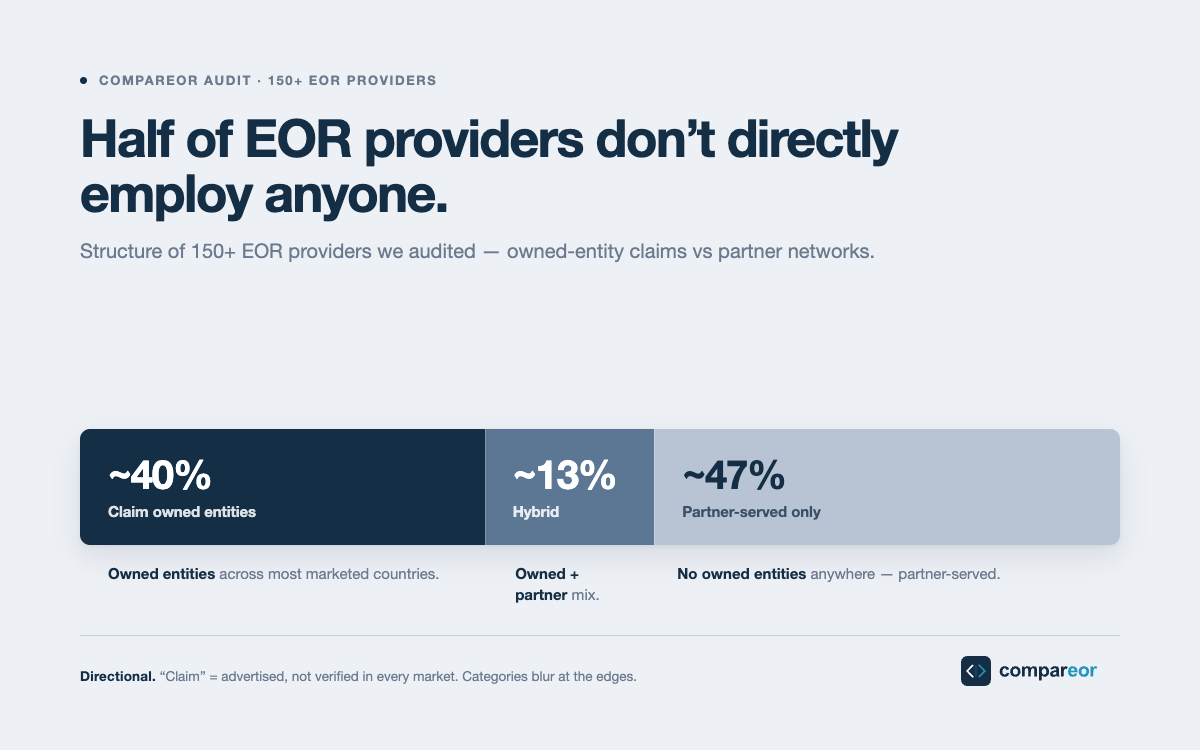
I checked the structure of 150+ EOR providers. Here's how many actually own their entities.
About 40% of EOR providers I audited claim and substantiate owned entities across most of their marketed countries. About 12 to 15% run an honest hybrid. About 45 to 50% are partner-served only, with no owned entities anywhere. The numbers, the methodology, the one honest caveat, and what they mean for buyers.

June 3, 2026
6 min read
Every EOR contract has an expiration date
The EOR model has a built-in expiration date, somewhere between 15 and 20 employees in one country. Past that threshold, the EOR stops being the cheapest option and starts being a tax on growth. Most companies miss it for a year or more, because the contract doesn't mention it and nobody inside is responsible for noticing.

May 25, 2026
5 min read
Why "150+ countries" is the most misleading number in global employment
Every EOR homepage leads with a country count, and after auditing 150+ providers it's the number most likely to lead you to the wrong choice. Coverage comes in three forms, and depth in your countries matters more than breadth across 185 of them.
Stay Updated on Global Hiring
Get weekly insights on EOR trends, compliance updates, and cost-saving strategies
Find a better EOR — without risk
Compare EOR providers to gain insights on cost, coverage, and contract flexibility, ensuring compliance and payroll continuity.
.png)
.png)


